World
New study tracks cities’ urban pulse to reveal uneven growth

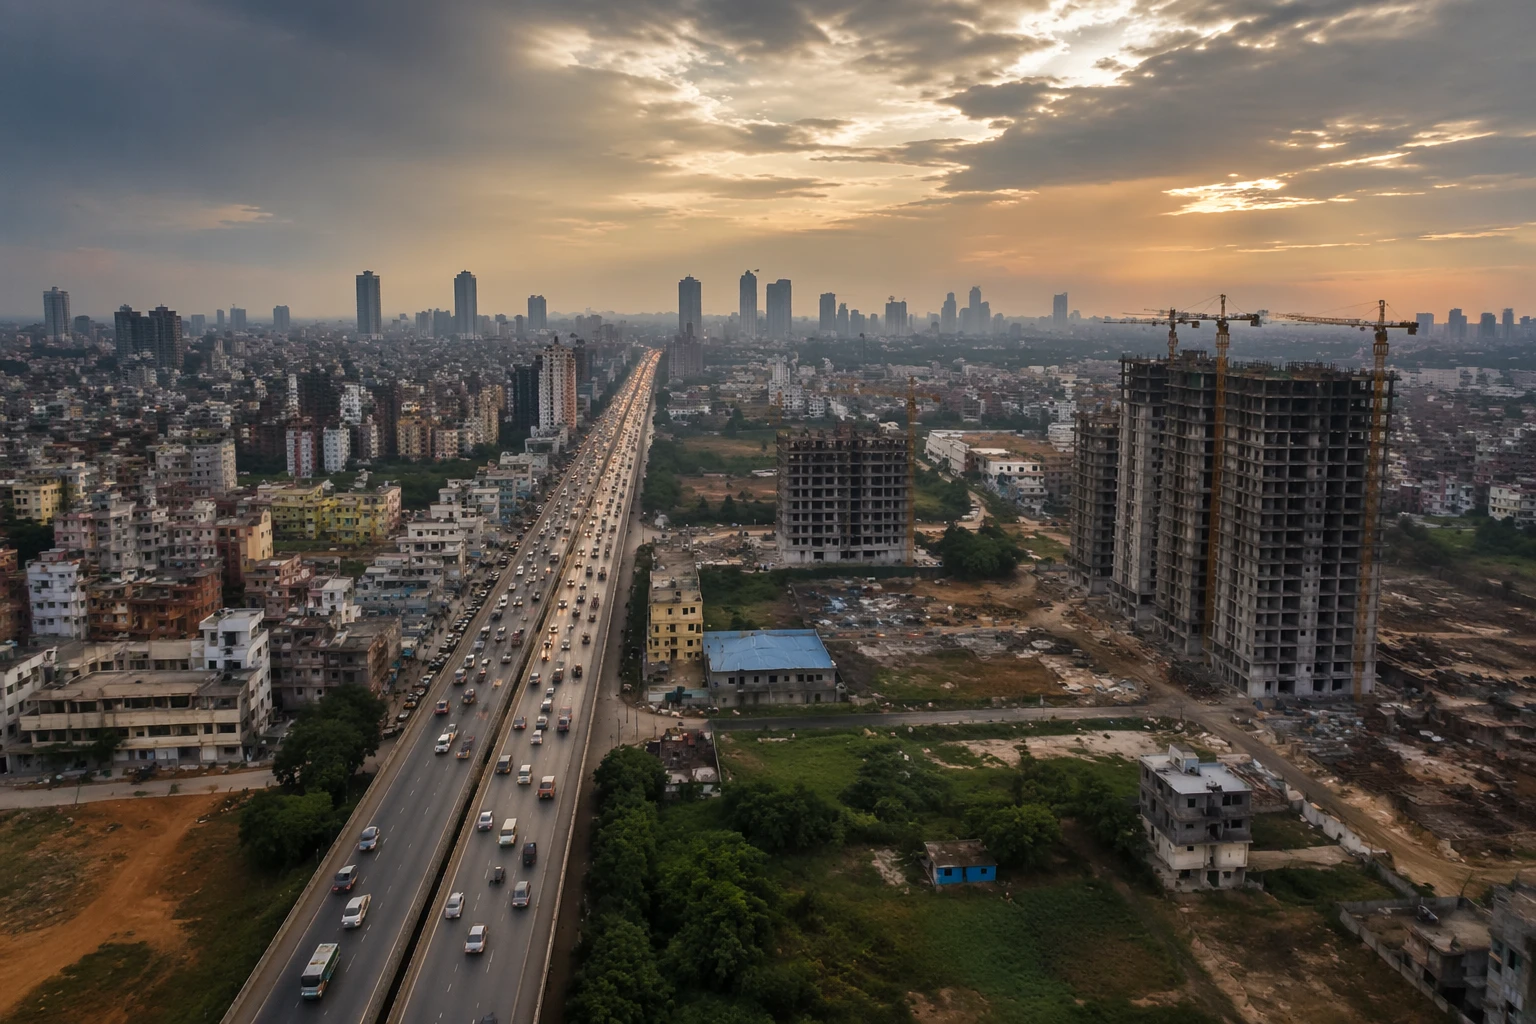
A city can look orderly on a map and still be deeply uneven on the ground. This new framework measures that imbalance by reading neighborhoods as they change over time, not as they appear in a single snapshot, and it gives planners a way to see development as a living pattern of bursts, delays and mismatched growth.
The question at the center of the study is practical: what can city leaders do with this data that static maps cannot? The answer is sharper timing. By tracking where construction intensifies, where it pauses and where activity shifts direction, planners can better judge when transit, zoning, emergency response and infrastructure investment need to move, not just where land use has already changed.
Why the urban pulse matters for city governance
Traditional tools such as a yearly census, an annual economic report or a decade-by-decade map of a city’s footprint are too blunt for fast-changing urban regions. They can show that a city grew, but not whether that growth came in sudden waves, whether one district surged while another stalled, or whether development in one part of town was disconnected from the rest.
That is the governance problem this study tries to solve. A planning office that sees only a broad average may miss the pressure building in a specific corridor, the slackening of construction in a vulnerable district or the early signs that a neighborhood is no longer absorbing investment. The researchers argue that urbanization is often spiky, cyclical and asynchronous, which means different parts of the same city can evolve on completely different timelines.
How the framework works
The study draws on dense, high-frequency satellite imagery from NASA’s Landsat missions and the European Space Agency’s Sentinel-2 system. Using a deep-learning and time-series approach called CAPES, the team tracked physical change at the neighborhood level across six major cities: Dubai, Lagos, Mexico City, Mumbai, Seattle and Shenzhen.
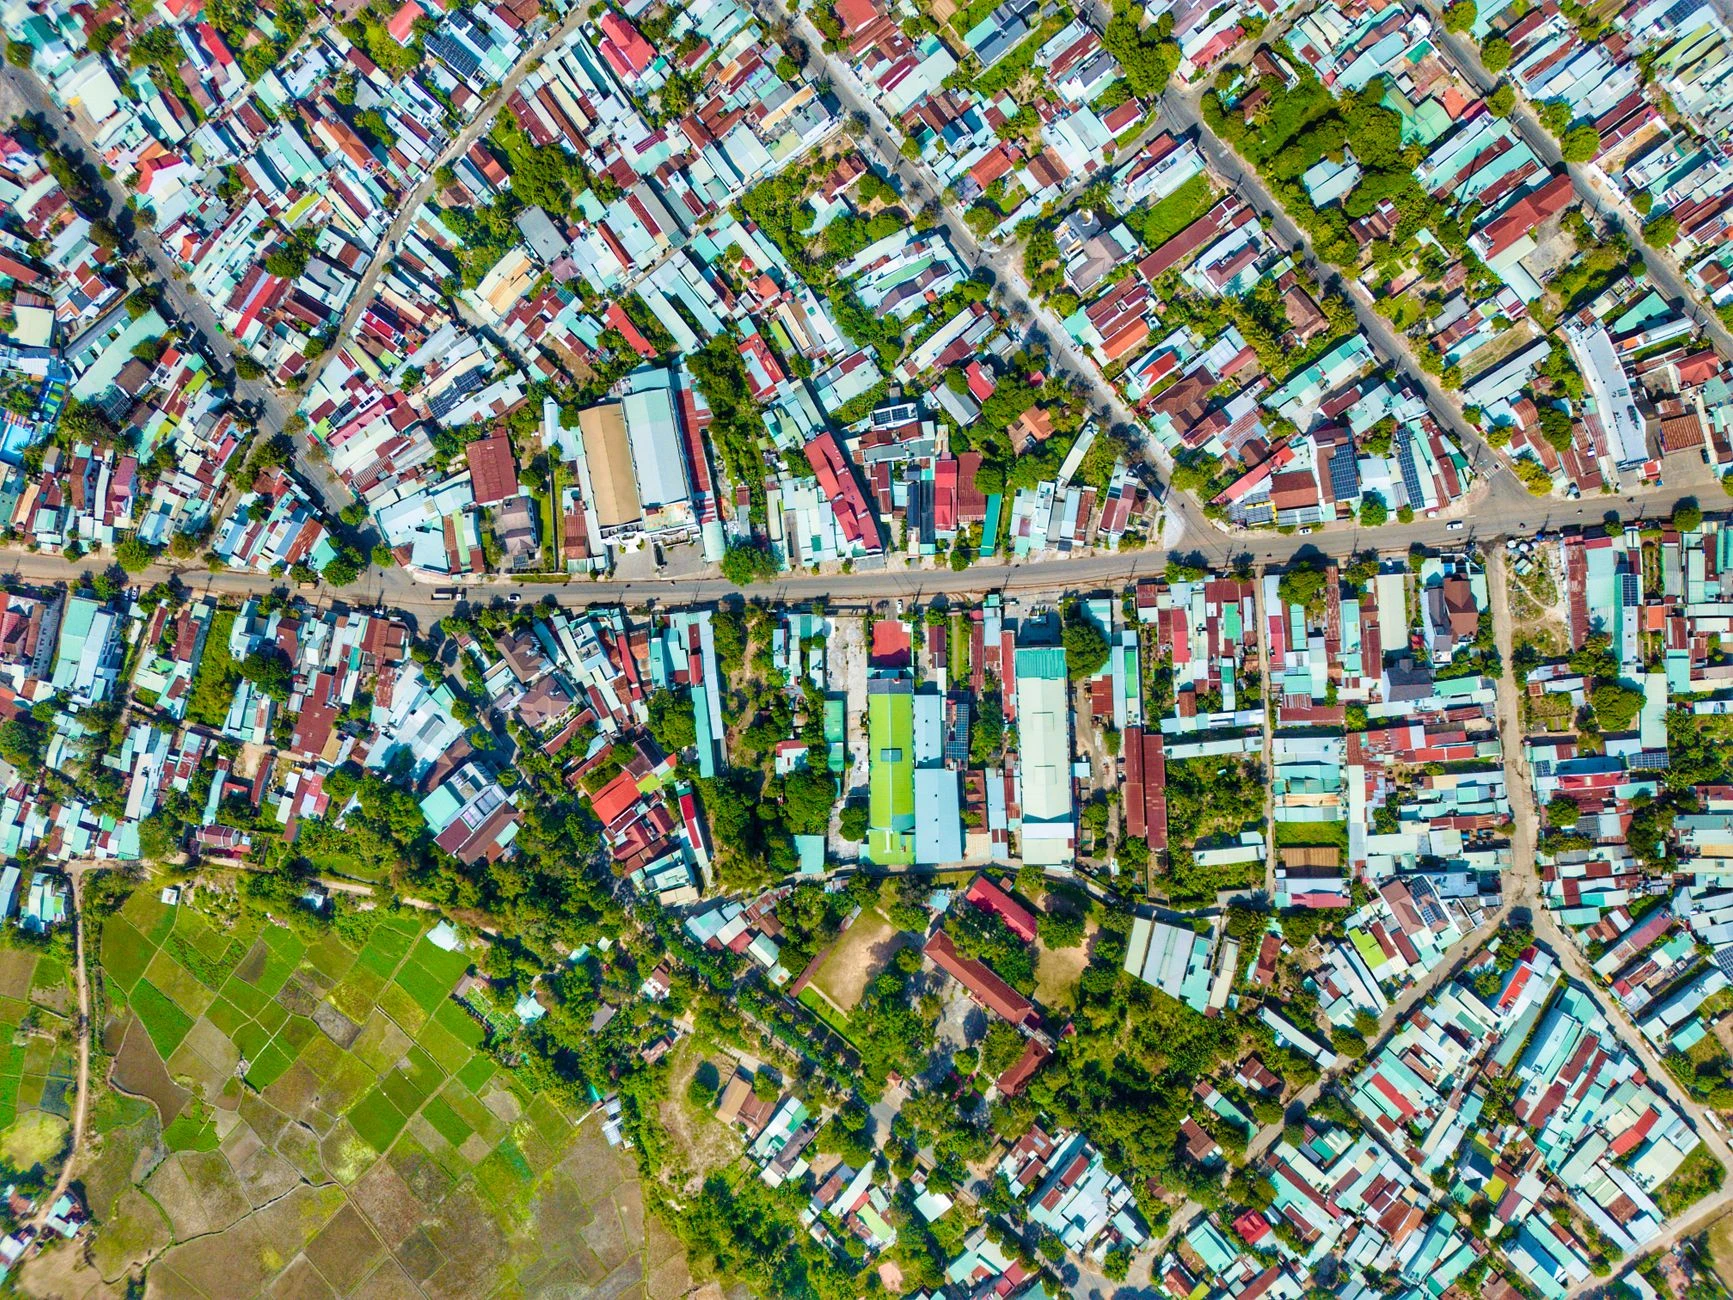
The Yale team also created a metric called Capital Infrastructure and Real Assets, or CIRA, to measure construction activity and intensity. That matters because the framework does not treat a city as one uniform machine. Instead, it measures how the built environment changes in place, which makes it possible to compare neighborhoods within the same metro area and see how unevenly development is distributed.
In the study’s logic, the urban pulse works like a vital sign. A human body can reveal stress through its rhythm even when height or weight tell you little, and the same idea applies here. The pattern of construction, expansion and pause can reveal speed, timing and unevenness that a static aerial image would miss.
What the six-city comparison shows
The six-city sample is important because it spans very different development contexts across Asia, Africa, the Middle East, North America and Latin America. Yet the framework found the same underlying lesson across all of them: neighborhood-scale construction can be highly uneven within one city.
That unevenness is not a minor detail. It means one district can be in an intense buildout phase while another, only a short distance away, is barely changing at all. For city governments, that can translate into mismatched sewer loads, uneven transit demand, fragmented housing pressure and infrastructure budgets that chase growth after the fact instead of anticipating it.
The researchers also used the Urban Pulse framework to assess how COVID-19 affected the six cities. That test shows the method is not limited to describing long-term growth. It can also be used to diagnose shocks and stress, which gives officials a way to see whether a disruption changed the tempo of development and where that change was concentrated.
What planners can do that static maps miss
The most immediate value of this approach is in timing. Static maps can show where development exists, but they cannot easily show whether a neighborhood is entering a boom, slowing down or shifting from one pattern of growth to another. That difference matters when a city has to decide where to extend transit lines, where to upzone, where to reinforce utilities and where emergency services may need new access routes.
A city that sees construction acceleration in one corridor may need to move infrastructure investment earlier, before bottlenecks harden. A district that suddenly falls behind the rest of the city may need attention for housing, public services or economic support before decline becomes obvious in standard data. And if several neighborhoods are moving asynchronously, a one-size-fits-all plan can miss the fact that the city is not growing as a single unit.
The framework also offers a way to read risk before it becomes a headline. Karen C. Seto of Yale said the method could provide early warnings of infrastructure strain, economic stagnation or environmental vulnerability at the neighborhood level. That is a significant shift for public management because it turns satellite data into an operational tool, not just a descriptive one.
Why the study matters now
The study was published in the Proceedings of the National Academy of Sciences and publicized on June 18, 2026, which places it among an emerging set of satellite-analysis methods rather than a settled planning standard. Its significance lies not in replacing local knowledge, but in giving officials a faster, finer-grained view of how cities actually change.
That could be especially useful in fast-growing cities in Asia, Africa and Latin America, where development can move faster than conventional statistics. It also matters for places like Seattle, where growth may be less explosive but still uneven, and for global hubs such as Dubai, Mexico City, Mumbai, Lagos and Shenzhen, where the spatial pattern of investment can shift quickly from one neighborhood to another.
The larger implication is clear: if cities are treated as living systems, planners can stop reacting to old maps and start governing according to motion. The urban pulse does not just show where a city is. It shows how it is changing, where pressure is accumulating and where public action will matter first.
Sources
- [1]uk.news.yahoo.com
- [2]eurekalert.org
- [3]today.uconn.edu
- [4]environment.yale.edu
- [5]phys.org
- [6]read.qxmd.com
- [7]usnews.com